Same predictions. Why does one account gain and the other lose?
When you compare two tests of a trading system, the final result can send you looking for the problem in the wrong place. Here you can follow every euro and separate a wrong prediction from the effect of the amount invested.
What are we comparing?
Predictions usually come from a statistical model: a calculation that uses market data to estimate how a price might move. A trading system combines that prediction with instructions about how much to buy. Those are two separate steps.
For this exercise, we give you three made-up predictions: the price will rise in each case. The third is marked as more convincing. That is an indication from the model, not a certainty. You don’t need to build or train a model to follow the calculation.
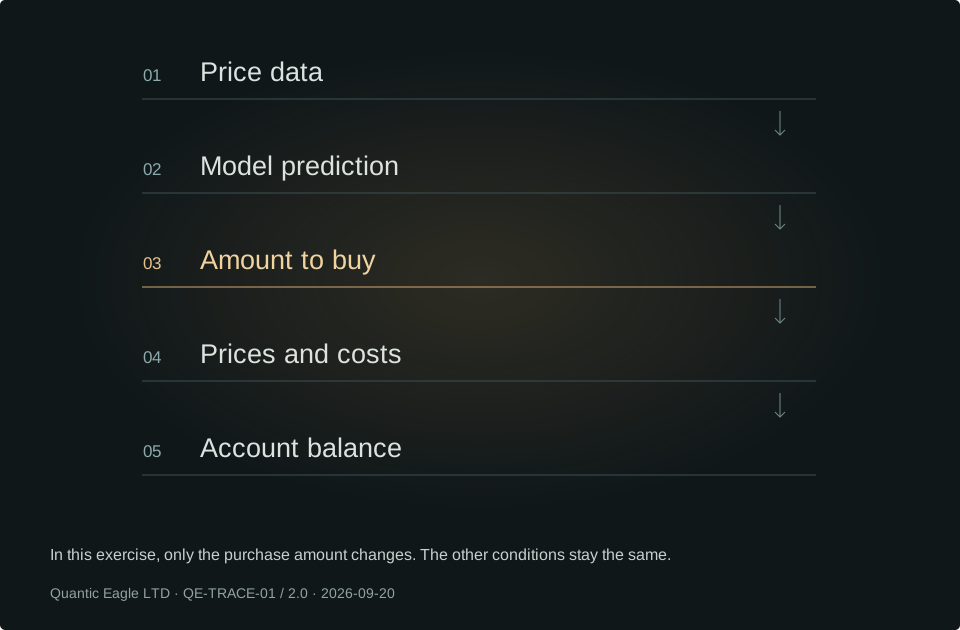
The first setting always buys €1,000 worth. The second buys €1,000 in each of the first two cases and €2,000 when the prediction is marked as more convincing. That is the only change we are examining.
Both accounts start with a simulated €10,000. Each purchase is of the same imaginary share and is sold before the next purchase. The assumed total cost of buying and selling is €2 per trade. All the prices and amounts are shown below: there are no other costs or cash movements in the calculation.
The prices and predictions are made up for this exercise. They are not Quantic Eagle trades or results.
The price rises in 2 out of 3 cases, with both settings.
Trade 1
100 → 102 €
Purchase price → sale price
Given prediction: price rise
€1,000 every time: +18 €
Variable amount for the third purchase: +18 €
Gain or loss, after €2 in costs
Trade 2
100 → 101 €
Purchase price → sale price
Given prediction: price rise
€1,000 every time: +8 €
Variable amount for the third purchase: +8 €
Gain or loss, after €2 in costs
Trade 3
100 → 98 €
Purchase price → sale price
Given prediction: price rise · The prediction is marked as more convincing
€1,000 every time: −22 €
Variable amount for the third purchase: −42 €
Gain or loss, after €2 in costs
What happens if you change only that amount?
Keep predictions, prices and costs fixed. Choose the amount for the third purchase in the second test and watch its closing balance change.
Follow the money in the third purchase
The price falls from 100 to 98: a 2% loss. With €1,000 invested, you lose €20 plus €2 in costs. With €2,000 invested, you lose €40 plus the same €2 in costs. The first two trades made €26 after costs. That is why one account finishes €4 up and the other €16 down.
“The model was right twice out of three” leaves out exactly this difference. When comparing versions of your system, check how much each buys. Otherwise, you may attribute a change to the model when it arose after the prediction.
What if the third purchase had made money?
Imagine a sale price of 102 rather than 98. Before opening the answer, try to say which account would have made more and why.
Let’s work through the answer
Then buying €2,000 worth would make €40 before costs, compared with €20 from buying €1,000 worth. A larger amount magnifies gains too. The useful lesson is to separate the quality of the predictions from the money you choose to put behind each one when judging a change.
A note to help with your next comparison
Note what stayed the same, what you changed and what you can conclude. Use the example below if it helps. Your text stays on this page; save it if you want to keep it after closing the page.
Let’s work through the answer
Predictions, prices and costs were the same. I compared €1,000 with €2,000 in the third purchase. The result changes from +€4 to −€16 because the same percentage loss hits twice as much money. I have not shown that the model got worse or which amount will be better in future.
How can you use this in your own project?
Take two simulations from your project and compare entry price, exit price, amount and costs for the same trades. If more than one thing changes, note it before attributing the result to the model. The other free cases explore different problems, with the data you need to follow them.
Data and calculations, if you want to check each step
You can read the inputs in the JSON file, a format for structured values and tables. If you already use Node.js, save the JavaScript program in the same folder and run the command shown. The code repeats the calculation using the prices and costs displayed here.
Download the example data (JSON) · Download the small checking program
node QE-TRACE-01.jsYou’ll get €10,004 for the fixed amount and €9,984 with €2,000 in the third purchase. The intermediate €1,500 test closes at €9,994. No additional libraries are required.
SVG · Account balance after each trade
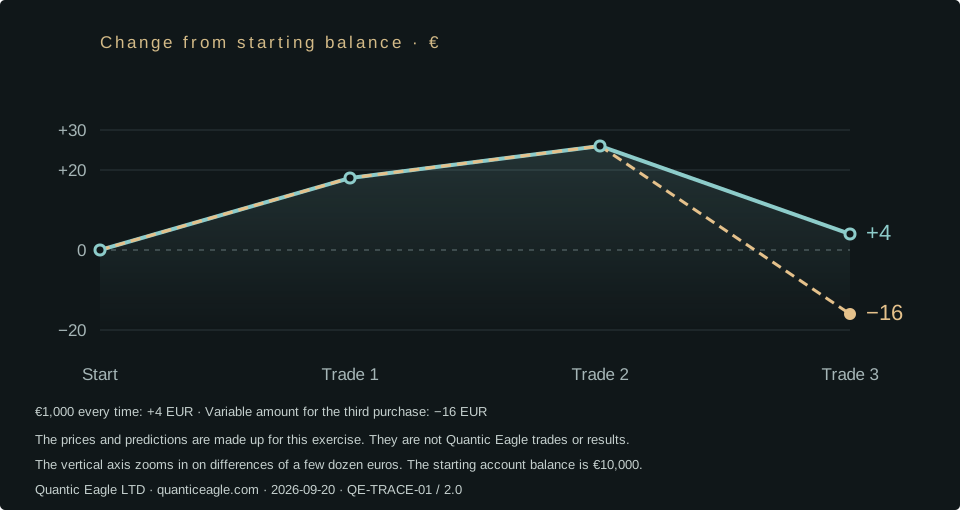
Quantic Eagle LTD. Same predictions. Why does one account gain and the other lose? QE-TRACE-01 · 2.0 · 2026-09-20. The prices and predictions are made up for this exercise. They are not Quantic Eagle trades or results.
You may download the data and adapt this example for practice, on your own or with your team. Keep the source credit and the note explaining that the data is made up. This permission covers the example, not the private fieldbook.
Version 2.0 redesigns the case around three simulated trades with explicit amounts, prices and costs. It replaces the earlier two-choice example, whose explanation did not provide enough context.