Trading systems research · Our own capital

Getting a result is one thing.
Knowing what it proves is another.

Quantic Eagle builds trading systems: programs that turn market analysis into decisions about what to buy or sell and how much. We trade only with our own capital; we do not raise or manage other people’s funds. Here we share cases that help you understand and check those decisions.

The profit is higher.
What actually improved?

Invented example · Not Quantic Eagle results

You are running a backtest: simulating a strategy’s buys and sells on past prices. You want to try a filter, an extra rule that skips some buy signals. Does it actually help you choose better trades?

  1. Original strategy

    Take every signal from the strategy, without the added filter. Use the same amount for each purchase.

    Trades
    48
    Per purchase
    €1,000
    Net profit
    €294
  2. Add the filter and double the amount

    The filter skips 12 trades. Expecting the remaining signals to be more reliable, you also choose to invest twice as much in each. Rerun the test over the same period.

    Trades
    36
    Per purchase
    €2,000
    Net profit
    €448

These are separate tests; you are not changing positions that are already open. Both start with a simulated €10,000 account. In the second test you use more of that money per trade, without adding money to the account. At a price of €100, for example, you buy 20 shares instead of 10.

You made €154 more. Was that because of the filter, or because you doubled the trade size? The second test changed both which trades you took and how much you invested in each.

01

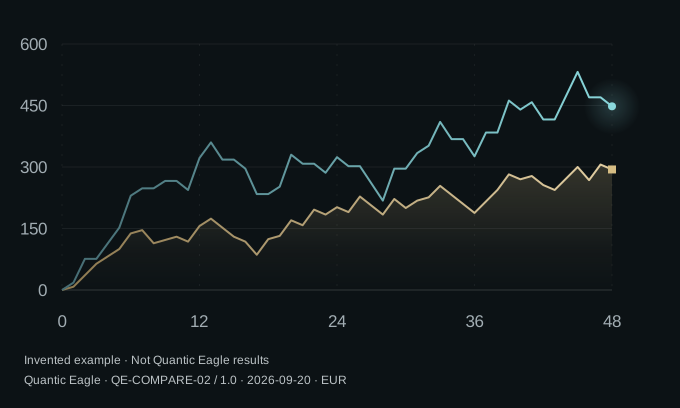
How profit builds up

Accumulated net profit · euros

How profit builds upInvented example · Not Quantic Eagle results. Accumulated net profit · euros. Without filter, €1,000 per trade: Net profit €294, Maximum balance drawdown €88. With filter, €2,000 per trade: Net profit €448, Maximum balance drawdown €142. The 48 buying opportunities in order. The balance stays flat when the filter skips a trade.0150300450600012243648
The 48 buying opportunities in order. The balance stays flat when the filter skips a trade.
Without filter€1,000 per trade+€294
With filter€2,000 per trade+€448
02

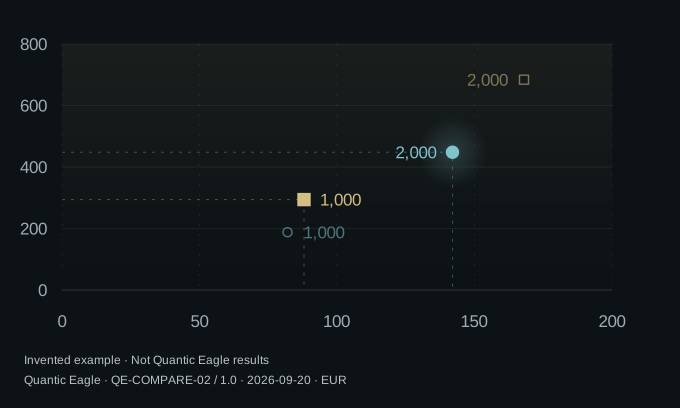
Net profit and maximum balance drawdown

Each point is a test: with or without the filter, buying €1,000 or €2,000 per trade.

Final net profit · €

Net profit and maximum balance drawdownInvented example · Not Quantic Eagle results. Each point is a test: with or without the filter, buying €1,000 or €2,000 per trade. Without filter, €1,000 per trade: Net profit €294, Maximum balance drawdown €88. With filter, €1,000 per trade: Net profit €188, Maximum balance drawdown €82. Without filter, €2,000 per trade: Net profit €684, Maximum balance drawdown €168. With filter, €2,000 per trade: Net profit €448, Maximum balance drawdown €142. A higher point means a larger final profit. A point further left means a smaller maximum drawdown: the account lost less money from a previous balance high. Here we measure the balance after each sale; temporary losses while a position is open are not visible.02004006008000501001502001,0001,0002,0002,000
Maximum balance drawdown · €

A higher point means a larger final profit. A point further left means a smaller maximum drawdown: the account lost less money from a previous balance high. Here we measure the balance after each sale; temporary losses while a position is open are not visible.

Without filterWith filter

Squares: no filter. Circles: filter applied. The number beside each point is the amount invested per trade in that test. The two filled symbols correspond to the comparison selected with the buttons.

More profit, but which change caused it?

You are comparing 48 trades at €1,000 without the filter against 36 at €2,000 with it. Profits are €294 and €448, but this comparison mixes two changes. Choose “Change only the filter” to see both versions buying €1,000 per trade.

This can happen when you try a new strategy version: you add a rule and adjust position sizes too. To find out which change helps, first compare versions with one thing changed at a time.

See all four tests, assumptions and calculations
Four separate simulations on identical prices. Compare rows with the same purchase amount to isolate the filter’s effect.
StrategyAmount per tradeNet profitMaximum balance drawdown
Without filter€1,000+€294€88
With filter€1,000+€188€82
Without filter€2,000+€684€168
With filter€2,000+€448€142

Reading profit and drawdown

At €2,000 per trade, you can also compare both strategies: profit is €684 without the filter and €448 with it. The filter therefore reduces profit by €236. Why is that not twice the €106 difference in the €1,000 tests? Doubling the amount doubles gross gains and losses, while the cost stays at €2 per trade. Skipping 12 trades always saves €24 in costs. These are this example’s assumptions, not a general law about filters or AI models.

Maximum balance drawdown is the largest fall from a balance high to a later low. For example, if the balance reaches €10,100 and then falls to €10,000, the drawdown is €100. Here we observe only the starting balance and the balance after each sale; the account could have lost more while shares were still held.

How the test is set up

Each test starts with €10,000. Trades are sequential: sell the entire position before opening the next one. Within each test, invest the same amount per trade, without leverage or increasing it as profits accumulate.

Every purchase is made at €100 per share. Sale prices and the 12 skipped trades are already fixed in the invented data. We are not searching for a profitable filter; these choices illustrate how to compare two versions. A completed trade costs €2 in total for buying and selling; a skipped trade has no cost or profit.

Equal amounts per trade do not guarantee equal risk: the filter changes which trades are taken. This example does not evaluate a real AI model or establish future profits. Other costs, differences between expected and actual execution prices, and order execution constraints are excluded.

node QE-COMPARE-02.js

Why compare every combination? NIST/SEMATECH explains experimental design and interactions between changes. It is a methodological reference, not a validation of this example.

QE-COMPARE-02 / 1.0 · 20.09.2026 · Quantic Eagle LTD

Two charts to explore losses and costs

01 / Risk along the way

Same endpoint. Different risks.

Illustration · invented data

Two paths can finish at the same level after exposing capital to very different losses.

  • Path A
  • Path B
Same endpoint. Different risks. — Illustration · invented dataTwo invented paths share the same starting and finishing level. Path B falls further from its peak and has not returned to that peak by the end.
Path B falls much further from its peak. Its final rise still leaves it below that peak. Looking only at where the two paths finish would miss this difference.
Depth
How far does it fall from its peak?
Duration
How long does it stay below that peak?
Recovery
Does it regain the peak within the period observed?

02 / Testing the assumptions

What happens when conditions change?

Illustration · invented data

A promising result may depend on low costs or execution that is hard to achieve. Those assumptions need testing too.

  • Reference assumptions
  • Higher costs
  • Less favourable execution
What happens when conditions change? — Illustration · invented dataThree invented scenarios share an initial path. Once the assumptions change, the paths with higher costs or less favourable execution diverge from the reference path and finish lower.
In the final part of this example, higher costs or less favourable execution reduce the gain and can turn it into a loss. These are invented scenarios, not forecasts or results from our systems.
Costs
Does the result hold up under less favourable assumptions?
Execution
Are the prices, timing and liquidity realistic?
Context
What changes in a different period?

Brand film · 49 seconds

Our capital.
We answer for every decision.

Questions to ask before trusting the test.

What change do you want to try?

If you add a rule to skip some purchases, compare the program with and without that rule. Use the same data so you can see what the change actually did.

Had that information arrived yet?

Suppose you make a decision on Monday at 10 am. News published at noon could not have helped, even if both entries have Monday’s date in your file.

What is left after the costs?

A simulation can look promising until you include fees and less favourable purchase prices. Run the numbers again before drawing a conclusion.

What do you really need to repeat?

If you change only the rule for choosing purchases, you may be able to reuse scores you have already calculated and checked. Repeat every test that depends on the new choice, though.

Changed the rule? Keep the previous version too.

On day 15 you add a rule and run the simulation again from the start of the month. The new chart can help you understand the change. It does not show what the program actually decided during the first fourteen days, when it was still using the old rule.

  1. Keep the decisions the program made at the time.
  2. Save the past rerun with the new rule separately.
  3. From now on, record which version you are using.

The prices and predictions are made up for this exercise. They are not Quantic Eagle trades or results.

IN PREPARATION · FREE RESOURCES AVAILABLE NOW

Turn your trading idea into a system you can test.

From individual backtests to model selection: worked cases and exercises to design your next experiment.

Before Capital is the practical fieldbook we are preparing for readers who already work with data and statistics. It takes you through choosing data, building tests and comparing versions of your system. The free cases are available now: follow the calculations and try the questions for yourself.

Open the interactive case →

Guide & tools · Open research desk

Research note · Market structure

Market efficiency is not binary.

A practical note on how information becomes price, why competition compresses opportunity and why systematic research is ultimately a test of what survives beyond the historical sample.

Read the research note

Clear boundaries

What Quantic Eagle is—and is not.

Clarity is part of the operating discipline. Quantic Eagle is built to deploy its own capital and to keep research, execution and governance inside a controlled perimeter.

Is

A proprietary systematic investment company.

  • Operates exclusively with company capital
  • Develops and operates quantitative investment infrastructure
  • Conducts research, selection and operations internally
  • May engage selectively on corporate and strategic matters

Is not

A public investment proposition.

  • Does not accept or manage third-party capital
  • Does not offer investment advice or accept client mandates
  • Does not sell signals, models, trading execution software or execution access
  • Does not publish operational secrets or account-level data
  • Is not authorised to manage third-party investment capital or provide regulated investment services to clients, and does not offer those services.

Understanding roles and relationships between owners

Looking into joining an existing company or working with its founders? We’ve brought those articles together in a separate reading path.

Understanding roles and relationships between owners
Educational note · 02

Investing in a company that already exists

Build, buy or back? A guide to what ownership means, what more capital changes and what risks remain.

Read the note on private company ownership
Educational note · 03

Joining an existing startup as a partner

Equity, capital, responsibilities and the questions to resolve before joining.

Read the note
Educational note · 04

After a startup: start again or join?

How to assess what happened and choose the next stage of an entrepreneurial career.

Read the note
Educational note · 05

Late co-founder, investor or employee?

Separate the title from ownership, work, capital and authority.

Read the note

Selective external dialogue

We are not seeking mandates. We remain open to discussions about the company, its technology or a potential collaboration.

Quantic Eagle may consider confidential corporate, strategic or infrastructure discussions with relevant counterparties able to evaluate the company, its quantitative IP and its operating platform. These discussions concern the company or strategic cooperation and are distinct from accepting capital to manage on behalf of others. Nothing on this website constitutes a public offer of shares in Quantic Eagle LTD.

Company & strategic enquiries

Company & strategic enquiries

A direct channel for relevant conversations.

Please provide enough context for us to assess your enquiry. This channel is for corporate, strategic and infrastructure matters. It does not handle requests for investment management, retail investment, signals or trading execution software.

Legal entity
Quantic Eagle LTD · Company no. 14897160
Registered office
71–75 Shelton Street, Covent Garden, London WC2H 9JQ, United KingdomStatutory registered office and correspondence address. Quantic Eagle operates through a digital working model; this address is not presented as a physical trading floor.
Official record
Companies House ↗
Contact channel
Company & strategic enquiries via the form

Use this form for company matters, technical collaborations, personal-data requests or security reports. We do not accept requests to manage your money or provide investment advice, trading signals or trade execution.

Protected by standard security and anti-abuse controls. Please do not include account credentials, trading data or other sensitive material.

Back to top